
How to view your analytics dashboard
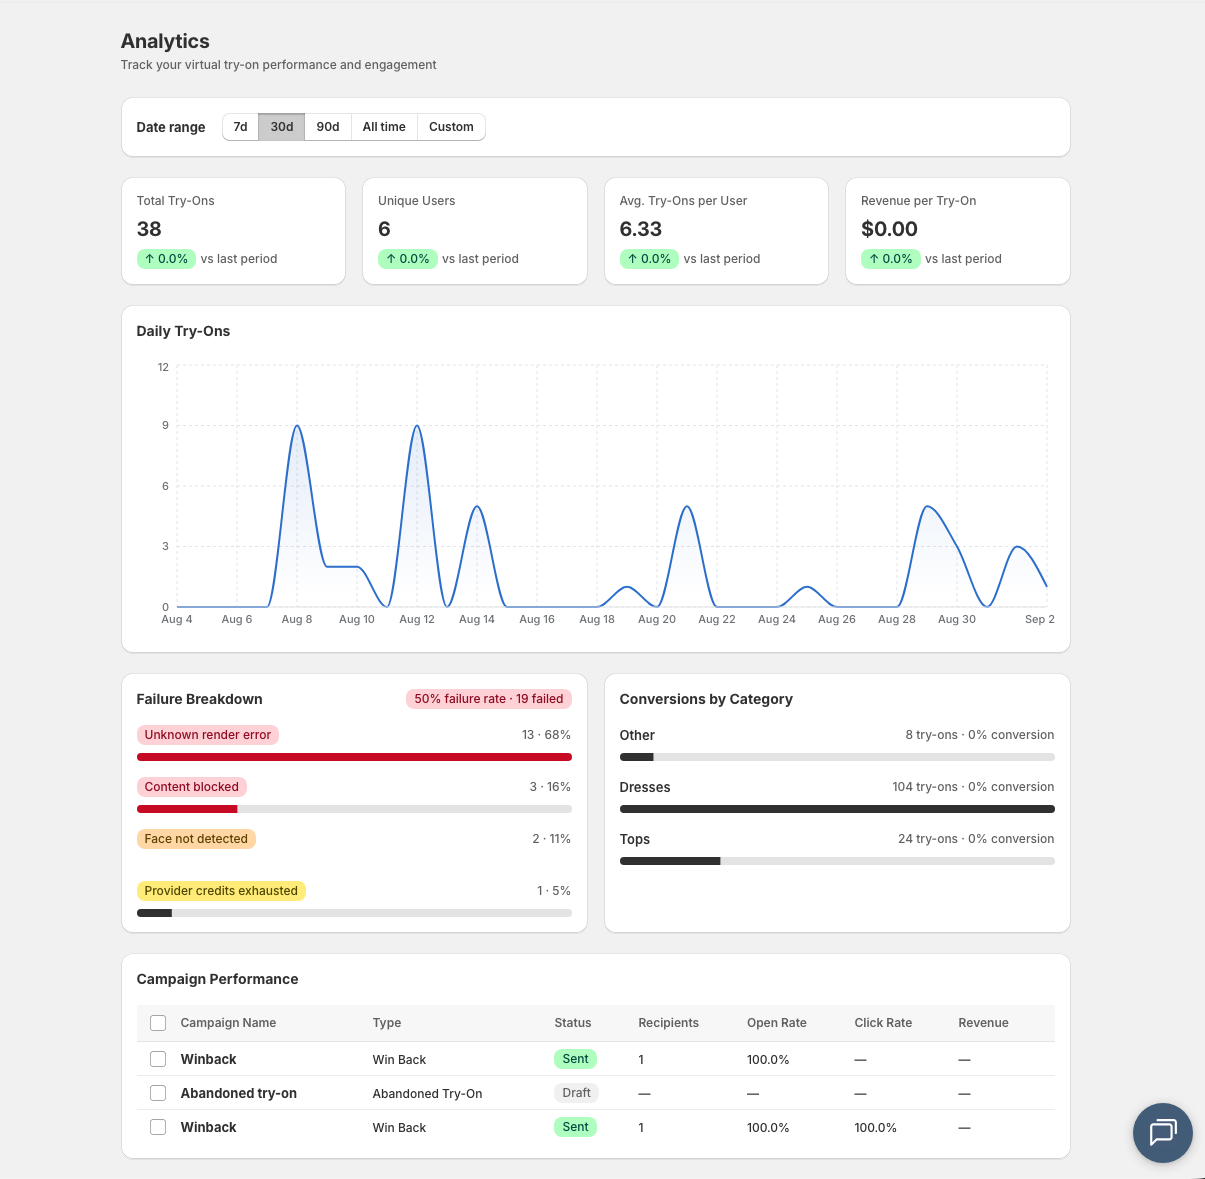
Track virtual try-on performance, monitor user engagement, and analyze conversion trends from the Analytics page.
Accessing the Analytics page
Log in to your Shopify admin
Go to Apps → MirrorNex
Click Analytics in the sidebar navigation
Choosing a date range
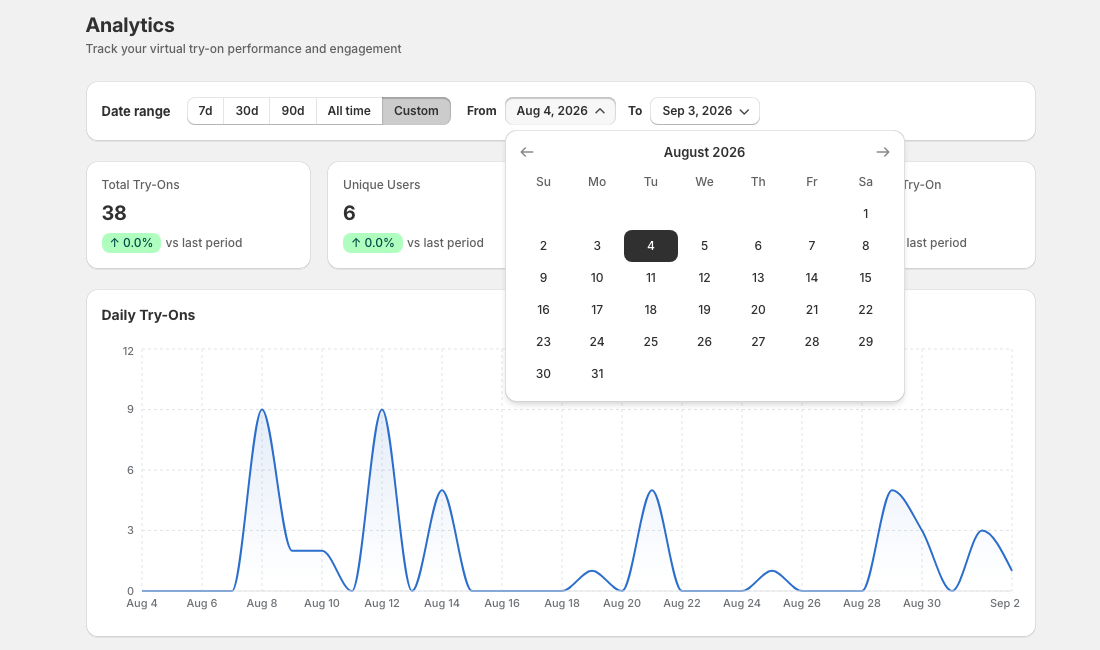
At the top of the Analytics page, you can filter data by time period:
- 7d — Last 7 days
- 30d — Last 30 days (default)
- 90d — Last 90 days
- All time — All historical data
- Custom — Pick specific start and end dates
When you select Custom, two date pickers appear so you can define the exact range.
Dashboard overview
The Analytics page displays several sections:
Key metrics cards
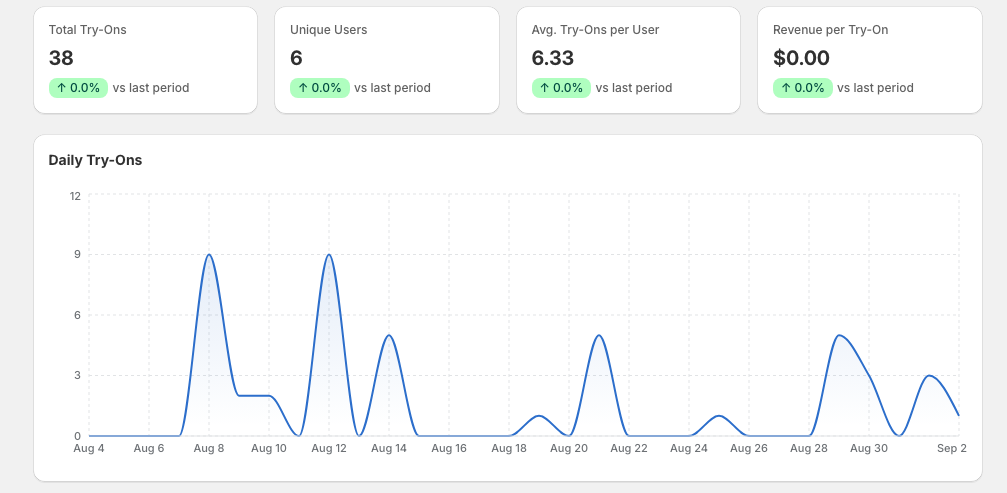
Four cards at the top show your most important numbers:
- Total Try-Ons — Total virtual try-ons in the selected period
- Unique Users — Number of distinct customers who used try-on
- Avg. Try-Ons per User — How many try-ons each user does on average
- Revenue per Try-On — Average revenue generated per try-on
Each card shows a trend badge comparing to the previous period (e.g., ↑ 12.5% vs last period).
Daily Try-Ons chart
A chart showing try-on volume by day, helping you spot trends and peak usage times.
Failure Breakdown
Shows why some try-ons didn't complete, categorized by reason (face not detected, image issues, timeouts, etc.). Helps identify technical issues affecting customers.
Conversions by Category
Breaks down try-ons and conversion rates by clothing category (tops, dresses, outerwear). Shows which product types get the most engagement.
Campaign Performance
If you've created email campaigns, this table shows their results: recipients, open rate, click rate, and revenue generated.