
Understanding Campaign Performance
The Campaigns page shows a performance overview with key metrics to help you understand how your email campaigns are performing. Here's what each metric means.
Performance overview
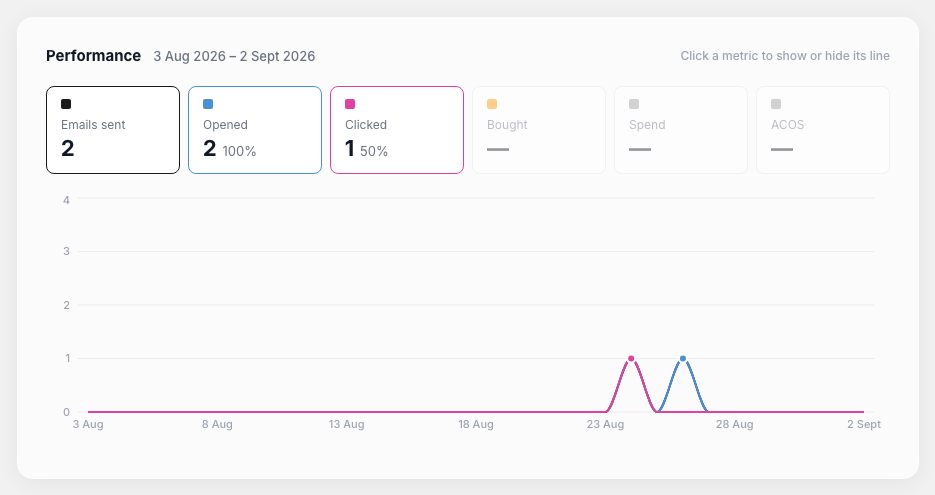
At the top of the Campaigns page, you'll see a performance card with six key metrics. You can also view an interactive chart that shows trends over time.
Key metrics explained
Emails Sent
The total number of emails successfully delivered across all your campaigns. This counts actual deliveries, not bounced or failed sends.
What it tells you: Your campaign reach and audience size.
Opened
The number of recipients who opened your email at least once. Also shown as an open rate percentage.
What it tells you: How effective your subject lines are at capturing attention.
Good benchmark: 15-25% open rate is typical for e-commerce emails.
Clicked
The number of recipients who clicked at least one link in your email. Also shown as a click-through rate (CTR).
What it tells you: How engaging your email content is and whether it drives action.
Good benchmark: 2-5% CTR is typical for e-commerce campaigns.
Bought
The number of recipients who made a purchase after clicking through from your campaign email.
What it tells you: How well your campaigns convert to actual sales.
Spend
The total cost of try-ons used by customers who engaged with your campaigns. This helps you track the investment in try-on experiences.
ACOS (Advertising Cost of Sales)
The ratio of your campaign spend to the revenue generated. Calculated as:
ACOS = (Spend ÷ Revenue) × 100%
What it tells you: Your campaign efficiency — lower ACOS means better return on investment.
Example: If you spent $50 on extra try-ons and generated $500 in sales, your ACOS is 10%.
Using the performance chart
The interactive chart below the metrics shows trends over time:
- Toggle metrics — Click metric names to show/hide them on the chart
- View trends — See how performance changes day-by-day or week-by-week
- Compare periods — Identify patterns and improvement opportunities
Campaigns by audience
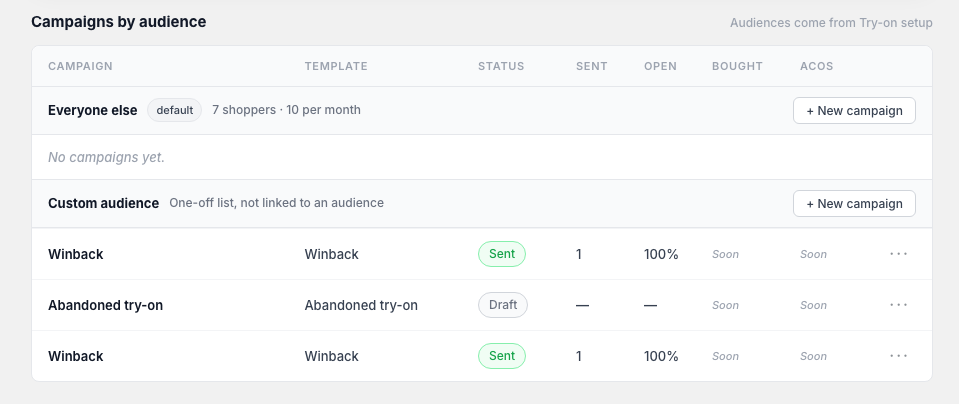
Below the performance overview, campaigns are grouped by the audience (try-on rule) they target. This makes it easy to see which audiences respond best to your campaigns.
Tips for improving performance
Low open rates?
- Test different subject lines
- Send at different times of day
- Segment your audience more specifically
Low click rates?
- Make your call-to-action more prominent
- Feature fewer products (2-3 works best)
- Include try-on result images when possible
High ACOS?
- Target customers who have shown purchase intent
- Focus campaigns on higher-priced products
- Send to engaged customers rather than cold lists